One page reference for various market info
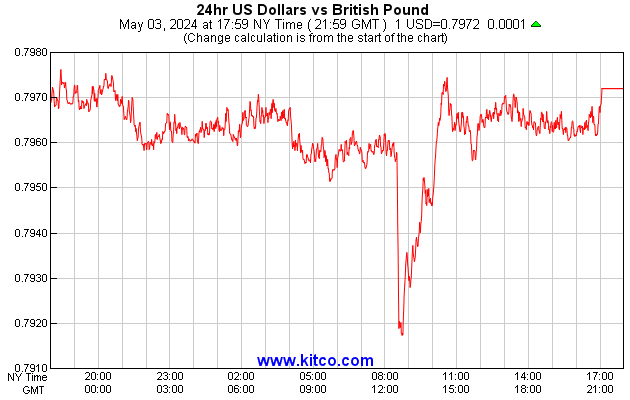
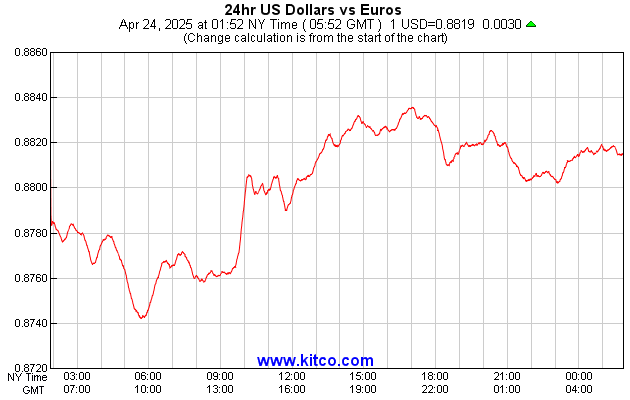
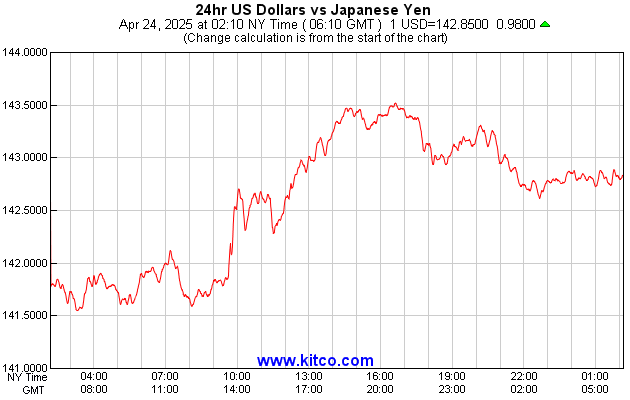
Currency
US Bonds
Treasury yields — trailing 12 months
All four maturities on one axis. Click through for the interactive version on FRED.

Current yield curve — today in blue vs. one year ago
Yield curve chart via RetireBeforeDad.com, data from US Treasury. Long-run history: FRED.
10y − 2y spread — negative means an inverted curve
Money Supply
M2 — 5yr, monthly, seasonally adjusted

Equities
Crypto
Energy
Crude Oil (WTI)
Natural Gas — Henry Hub spot, trailing 12 months

Uranium — no public spot price feed exists, so this tracks the Global X Uranium ETF (URA) as a proxy
Metals
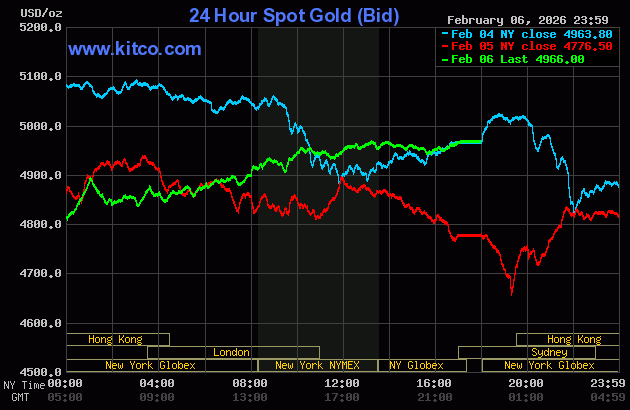
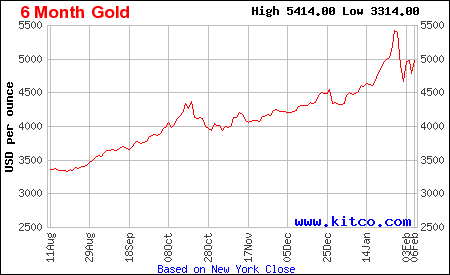
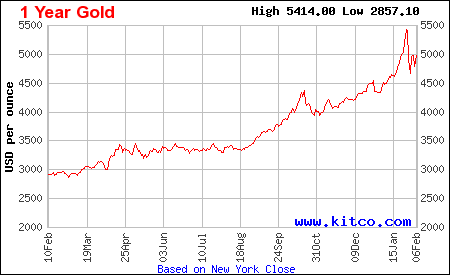
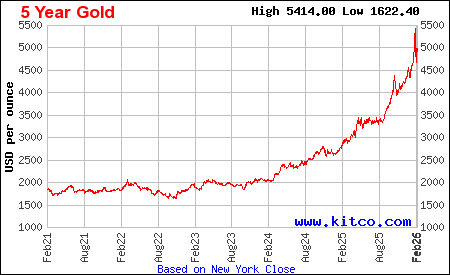
Gold — 24h · 6mo · 1yr · 5yr
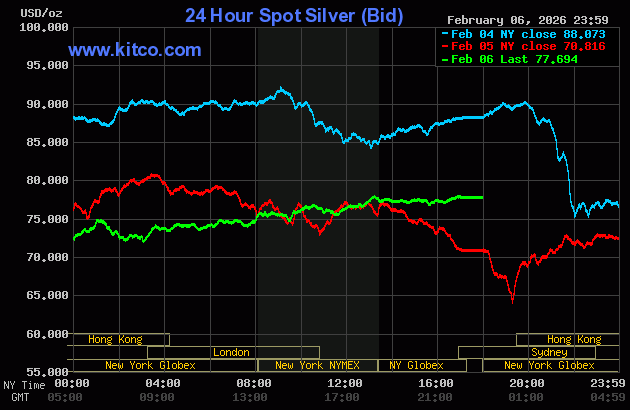
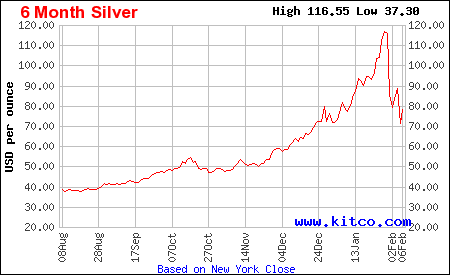
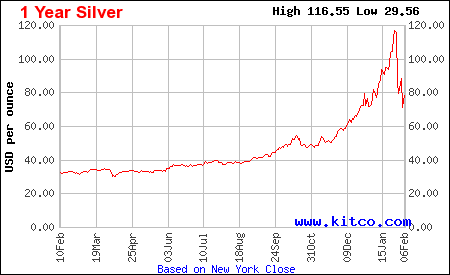
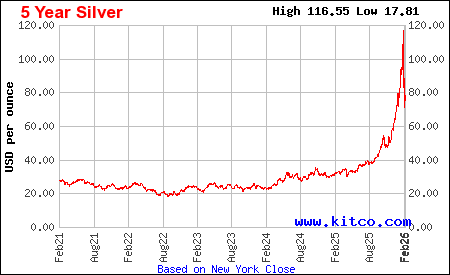
Silver — 24h · 6mo · 1yr · 5yr
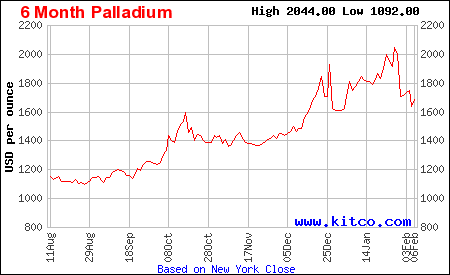
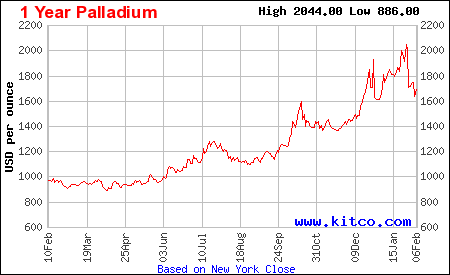
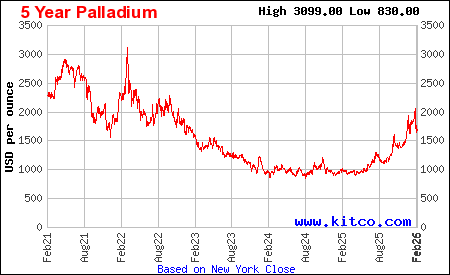
Palladium — 6mo · 1yr · 5yr
Copper
Aluminum